
May 24, 2013
The long-awaited Penguin 2.0 (also called "Penguin 4") rolled out on Wednesday, May 22nd. Rumor has been brewing for a while that the next Penguin update would be big, and include significant algorithm changes, and Matt Cutts has suggested more than once that major changes are in the works. We wanted to give the dust a day to settle, but this post will review data from our MozCast Google weather stations to see if Penguin 2.0 really lives up to the hype.
Short-Term MozCast Data
First things first - the recorded temperature (algorithm "flux") for May 22nd was 80.7°F. For reference, MozCast is tuned to an average temperature of about 70°, but the reality is that that average has slipped into the high 60s over the past few months. Here's a 7-day history, along with a couple of significant events (including Penguin 1.0):
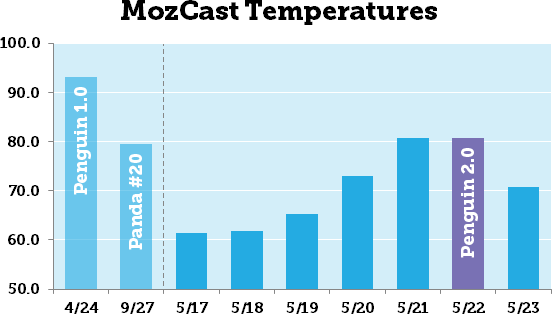
By our numbers, Penguin 2.0 was about on par with the 20th Panda update. Google claimed that Penguin 2.0 impacted about 2.3% of US/English queries, while they clocked Panda #20 at about 2.4% of queries (see my post on how to interpret "X% of queries"). Penguin 1.0 was measured at 3.1% of queries, the highest query impact Google has publicly reported. These three updates seem to line up pretty well between temperature and reported impact, but the reality is that we've seen big differences for other updates, so take that with a grain of salt.
Overall, the picture of Penguin 2.0 in our data confirms an update, but it doesn't seem to be as big as many people expected. Please note that we had a data collection issue on May 20th, so the temperatures for May 20-21 are unreliable. It's possible that Penguin 2.0 rolled out over two days, but we can't confirm that observation.
Temperatures by Category
In addition to the core MozCast data, we have a beta system running 10K keywords distributed across 20 industry categories (based on Google AdWords categories). The average temperature for any given category can vary quite a bit, so I looked at the difference between Penguin 2.0 and the previous 7 days for each category. Here they are, in order by most impacted (1-day/7-day temps in parentheses):
- 33.0% (80°/60°) – Retailers & General Merchandise
- 31.2% (81°/62°) – Real Estate
- 30.8% (90°/69°) – Dining & Nightlife
- 29.1% (89°/69°) – Internet & Telecom
- 26.0% (82°/65°) – Law & Government
- 24.4% (79°/64°) – Finance
- 23.5% (81°/65°) – Occasions & Gifts
- 20.8% (88°/73°) – Beauty & Personal Care
- 17.3% (70°/60°) – Travel & Tourism
- 15.7% (87°/75°) – Vehicles
- 15.5% (84°/73°) – Arts & Entertainment
- 15.4% (72°/62°) – Health
- 15.0% (83°/72°) – Home & Garden
- 14.2% (78°/69°) – Family & Community
- 13.4% (79°/70°) – Apparel
- 13.1% (78°/69°) – Hobbies & Leisure
- 12.0% (74°/66°) – Jobs & Education
- 11.5% (88°/79°) – Sports & Fitness
- 7.8% (75°/70°) – Food & Groceries
- -3.7% (70°/73°) – Computers & Consumer Electronics
Retailers and Real Estate came in at the top, with just over 30% higher than average temperatures. Consumer Electronics rounded out the bottom, with slightly lower than average flux, oddly. Of course, split 20 ways, this represents a relatively small number of data points for each category. It's useful for reference, but I wouldn't read too much into these breakdowns.
"Big 20" Sub-domains
Across the beta 10K data-set, we track the top sub-domains by overall share of SERP real-estate. Essentially, we count how many page-1 positions each sub-domain holds and divide it across the entire data set. These were the Big 20 sub-domains for the day after Penguin 2.0 hit, along with their SERP share and 1-day change:
- 5.66% (+0.29%) – en.wikipedia.org
- 2.35% (-0.75%) – www.amazon.com
- 2.22% (+3.11%) – www.youtube.com
- 1.49% (+6.05%) – www.facebook.com
- 1.35% (-8.11%) – www.yelp.com
- 0.84% (+4.77%) – twitter.com
- 0.58% (+0.37%) – www.webmd.com
- 0.58% (+1.87%) – pinterest.com
- 0.52% (+1.24%) – www.walmart.com
- 0.49% (+4.54%) – www.tripadvisor.com
- 0.47% (+0.45%) – www.foodnetwork.com
- 0.47% (-0.44%) – allrecipes.com
- 0.44% (+1.98%) – www.ebay.com
- 0.41% (-0.76%) – www.mayoclinic.com
- 0.38% (+1.72%) – www.target.com
- 0.37% (-4.37%) – www.yellowpages.com
- 0.37% (+0.58%) – popular.ebay.com
- 0.36% (+2.12%) – www.huffingtonpost.com
- 0.33% (+3.27%) – www.overstock.com
- 0.32% (-0.32%) – www.indeed.com
By percentage change, Yelp was the big day-over-day loser, at -8.11%, and Twitter picked up the highest percentage, at +4.77%. In absolute positions, YouTube picked up the most page-1 rankings, and Yelp was still the biggest loser. Overall, the Big 20 occupied 20.00% of the page-1 real estate the day after Penguin 2.0, up from 19.88% the previous day, picking up a modest number of ranking positions.
3rd-Party Analyses
I'd just like to call out a few analyses that were posted yesterday based on unique data, since there are bound to be a lot of speculative posts in the next few weeks. SearchMetrics posted its Penguin 2.0 biggest losers list, with porn and gaming sites taking the heaviest losses (Search Engine Land provided additional analysis). GetStat.com showed a jump in Top 100 rankings for big brands, but relatively small changes for most sites, and most of those changes on pages 3+ of SERPs.
Most reports yesterday showed relatively modest day-over-day changes (solid evidence of an algorithm update, but not a particularly big update). One exception was Dejan SEO's Australian flux tracker, Algoroo, which showed massive day-over-day flux. We believe that at least two other major algorithm updates have rolled out in May in the US, so it's possible that multiple updates were combined and hit other countries simultaneously. This is purely speculative, but no other reports seem to suggest changes on the scale of the Australian data.
The May 9th Update
I'd like to also call out an unconfirmed algorithm update in early May. There was a period of heavy flux for a few days at the beginning of the month, which was backed up by webmaster chatter and other 3rd-party reports. Temperatures on May 9th reached 83.3°F. The MozCast 7-day graph appears below:
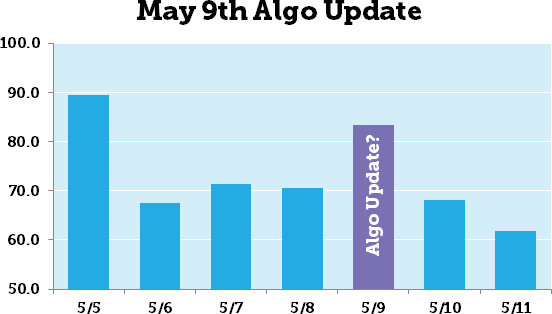
The temperature spike on May 5th is unconfirmed, and may have been a test across a small number of data centers (unfortunately, our 10K data for that day was running a separate test and so we can't compare the two data sets). Reports of updates popped up across this time period, but our best guess is May 9th. Interestingly, traffic to MozCast tends to reveal when people suspect an update and are looking for confirmation, and the traffic pattern shows a similar trend:
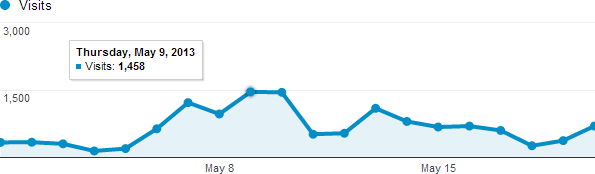
Traffic data also suggest that May 5th was probably an anomaly. Private data from multiple SEOs shows sites gradually losing traffic over a couple of days in this period. Unfortunately, we have no clear explanation at this time, and I do not believe that this was directly related to Penguin 2.0. Google did roll out a domain crowding update at some point in the past couple of weeks, which may be connected to the early May data, but we don't have solid evidence either way. At this point, though, I strongly believe that the data indicates a significant algorithm update around May 9th.
Were You Hit by Penguin 2.0?
It's important to keep in mind that all of this is aggregate data. Algorithm updates are like unemployment rates. If the unemployment rate is 10%, the reality for any individual is still binary – you either have a job or you don't. You can weather 20% unemployment if you have a job (although you may worry more), and 5% unemployment is little comfort if you're jobless. I don't want to suggest any lack of empathy for those hit by Penguin 2.0 by suggesting that the update was relatively small, but overall the impact seems to be less jarring and jolting than many people feared. If you were hit, please share your story in the comments.


 2nd Floor, Khawar Center, Multan, Pakistan.
 +92-61-450-4650
 +92-61-451-4650

 greenfintech