
July 25, 2013
Back on June 21st, Matt Cutts replied to a tweet about payday loan spam with an unusual bit of information (reported on Search Engine Roundtable):
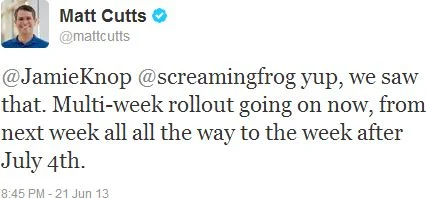
The exact timeline was a bit unclear, but Matt seemed to suggest a prolonged algorithm update covering as many as three weeks. Four days later, we tracked our highest temperature ever on MozCast, followed by more record highs:
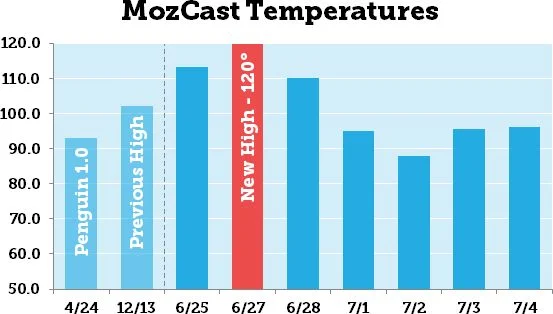
Seven days during the "multi-week" timeline showed temperature spikes near or above 90°, with six of those days exceeding the severity of the original Penguin update.
Was It A MozCast Glitch?
Let me perfectly honest – Google rankings are a moving target, and tracking day-to-day flux has proven difficult at best. Any given temperature on any given day is prone to error. However, this was a sustained pattern of very high numbers, and we have no evidence to suggest a glitch in the data.
There were some reports that other tools were not showing similar spikes, but some of these reports were based on apples-to-oranges comparisons. For example, if you look at SERPmetrics flux data and isolate just page 1 of Google (which is what MozCast tracks), you'll see this:
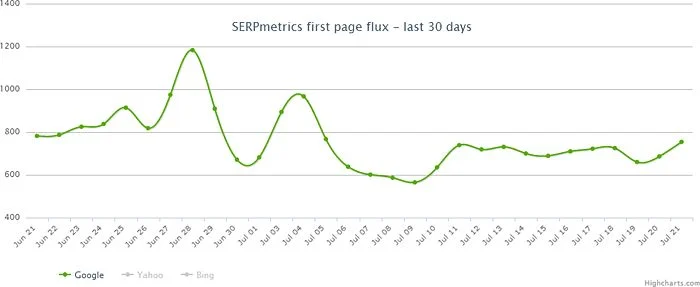
Sorry, it's a bit hard to see the dates on the reduced image, but the two spikes equate to roughly June 28th and July 4th, with a smaller bump on June 25th. While they're not an exact match, these two data sets are certainly telling a similar story.
Was It A Large-scale Test?
This is a much harder question to answer. Our beta 10K data set showed similar patterns across multiple C-blocks of IPs, so we have no reason to believe this was specific to one or a very few data centers.
What if Google made a massive change one day, though, and then reverted it? Theoretically, we would see two days of high MozCast temperatures, but if we looked at the two-day flux (instead of two one-day numbers), the temperature would be very low. While this multi-day flux is theoretically interesting, it can be very hard to interpret in practice. Some rankings naturally change, and Google can roll out multiple small updates in any given week.
If we look at the overall flux between the start and end of recorded spikes (June 25 - July 4), we get a MozCast temperature of 120.3°, not much higher than the one-day temperature on June 27th. The average daily temperature for this period was 92.5°. Now, let's look at a similar time period (May 28 - June 6) – the average temperature for that period was 66.8°, and the multi-day temperature across the entire period was 114.7°.
Comparing the two time periods, the overall flux for the period of record temperatures was roughly the same as the peak and about 30% higher than the multi-day average, whereas the overall flux for the quieter period was 72% higher than the average. This is an inexact science at best, and we don't have a good historical sense of multi-day patterns, but my gut feeling is that some of the multi-week update involved changes that Google tested and later rolled back.
What About PMDs & EMDs?
In my post on the June 25th temperature spike, I reported a noticeable single-day drop in partial-match domain (PMD) influence. That post happened very early in the multi-week update, so let's look at the PMD influence data across a 30-day time period that includes all of the high-temperature days:
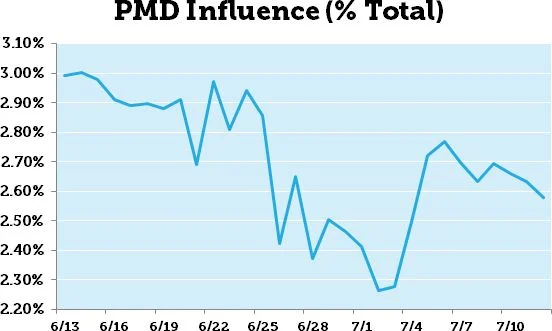
While there was a lot of movement during this period, you can see that PMDs recovered some of their initial losses around July 4th. The overall trend is downward, but the June 25th drop doesn't appear to have been permanent.
It's interesting to note, even if not directly relevant to this analysis, that the long-term trend for PMD influence in our data is still decidedly downward. Here's a graph back to the beginning of 2013:
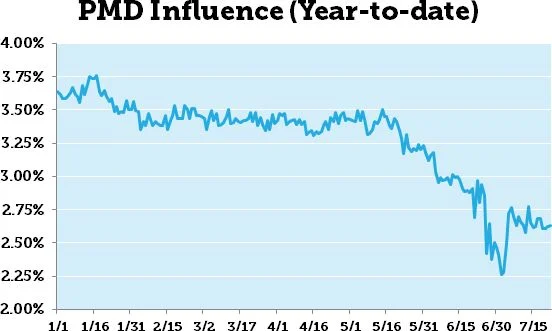
So, how have EMDs fared? They seem to show a similar pattern, but in a much tighter range. Scaled to the same Y-axis as the PMD chart above, we get this:
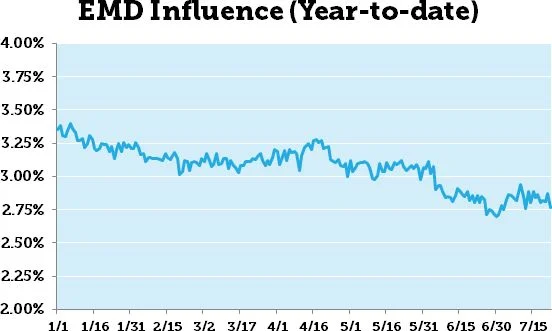
The EMD data is fairly consistent with Dr. Matt Peters' early report on our 2013 Ranking Factors study. Keep in mind that we are measuring two different things – the correlations show how well PMDs/EMDs ranked compared to other domains, whereas MozCast tracks how many PMDs/EMDs ranked across the data set. If the number of total PMDs drops, but they rank roughly as well, the correlations will remain stable, but the "PMD Influence" metric will drop. In other words, the correlations measure how well PMDs rank, whereas MozCast measures how many PMDs rank.
Which PMDs Lost Long-term?
There's one more question we can ask about the drop and subsequent recovery in PMD influence. Did the PMDs that fell out eventually come back, or were they replaced by different PMDs? The metric itself doesn't tell us, but we can dig deeper and see who lost out long-term.
On the initial drop (between June 25-26), 62 PMDs fell out of our public 1K MozCast query set. New PMDs always enter the mix, so the net drop is smaller, but 62 PMDs that were ranking on June 25th weren't ranking on June 26th. So, let's compare that list of 62 to the data on July 5th – after the apparent recovery. On July 5th, 37 of those PMDs (60%) had returned to our data set. This certainly suggests some amount of legitimate recovery.
So, which losing PMDs failed to recover? Here's the complete list (query keywords in parentheses):
- californiacarshows.org (car shows)
- digital-voice-recorder-review.toptenreviews.com (voice recorder)
- fullyramblomatic-yahtzee.blogspot.com (yahtzee)
- virginiamommymakeover.com (mommy makeover)
- www.appliancepartscenter.us (appliance parts)
- www.appliancepartssuppliers.com (appliance parts)
- www.campagnolorestaurant.ca (campagnolo)
- www.campagnolorestaurant.com (campagnolo)
- www.capitalcarshows.com (car shows)
- www.chicagoweddingcandybuffet.com (candy buffet)
- www.dollardrivingschool.com (driving school)
- www.elitedrivingschool.biz (driving school)
- www.etanzanite.com (tanzanite)
- www.firstchoicedrivingschool.net (driving school)
- www.fitzgeraldsdrivingschool.com (driving school)
- www.monogrammedgiftshop.com (monogrammed gifts)
- www.moscatorestaurant.com (moscato)
- www.newjerseyluxuryrealestate.com (luxury real estate)
- www.ocsportscards.com (sports cards)
- www.phoenixbassboats.com (bass boats)
- www.rvsalesofbroward.com (rv sales)
- www.sri-onlineauctions.com (online auctions)
- www.stoltzfusrvs.com (rvs)
- www.vibramdiscgolf.com (vibram)
It's not my goal to pass judgment on the quality of these domains, but simply to provide data for further analysis if anyone is interested. You can see that there are a few examples of multiple PMDs falling out of a single query, suggesting some kind of targeted action.
How Did The Big 10 Do?
In MozCast, we track a metric called the "Big 10" (I did my grad work at U. Iowa, so I should probably have thought twice about that name) – it's just a count of the total percentage of top 10 ranking positions held by the 10 most prominent sites on any given day. Those sites may change day-to-day, but tend to be fairly stable. Looking back to the beginning of 2013, we see a clear upward trend (this graph starts on January 8th, due to a counting issue we had with YouTube results at the beginning of the year):
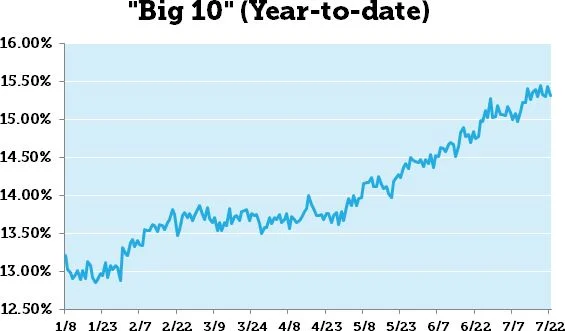
The "Big 10" gained almost 2-1/2 percentage points in the first half of the year. Some of the gain across the year represents a shuffling of sites in the mix (Twitter falls in and out of the "Big 10", for example, and the root eBay domain struggled earlier this year), and some of this is a symptom of other changes. As Google gets more aggressive about spam, the sites that already dominate naturally tend to take more spots.
I thought it would be interesting to look at these numbers alongside the year-to-date PMD and EMD numbers, but the "Big 10" doesn't seem to tell us much about the multi-week update. As a group, they moved only a fairly small amount between June 25th and July 5th (from 14.97% to 15.17%). Whatever Google tested and rolled out over this period, it didn't dramatically advantage big brands in our data set.
What Happened, Then?
Unfortunately, the patterns just aren't clear, and digging into individual queries that showed the most movement during the multi-week update didn't reveal any general insights. The volatility during this time period seems to have been real, and my best guess is that while some changes stuck, others were made and rolled back. Google may have been doing large-scale testing of algorithm tweaks and refining as they went, but at this point the exact nature of those changes is unclear. Between the multi-week update and Google's announcement of 10-day Panda roll-outs, it appears that we're going to see more prolonged updates. Whether this is to mitigate the impact of one-day updates or make the update process more opaque is anyone's guess.


 2nd Floor, Khawar Center, Multan, Pakistan.
 +92-61-450-4650
 +92-61-451-4650

 greenfintech